When measuring social media campaigns, a few metrics often dominate the conversation: engagement, followers, and impressions. While this data is helpful – especially in determining what kind of writing and content you should use in your ad campaigns – one critical metric is often overlooked: revenue.
Advertising on Meta (Facebook and Instagram) can be an excellent place for e-commerce and B2C companies to allocate marketing dollars. According to Sprout Social, 98% of consumers planned to make at least one purchase on social media in 2022. In fact, 68% of consumers have already purchased directly from social media.
Are you handling Meta Ad campaigns for your business or clients? If you’re like me, you need to track the revenue your ads are bringing in to gauge their effectiveness.
In an effort to maximize ROI on client ad spend, we set up Meta reporting to look at three key metrics for success:
- Purchase Conversion Value
- Cost Per Purchase
- Return on Ad Spend

Before diving into the specifics of these metrics, it’s important to understand how to set up Ad Reporting in Meta Business Suite.
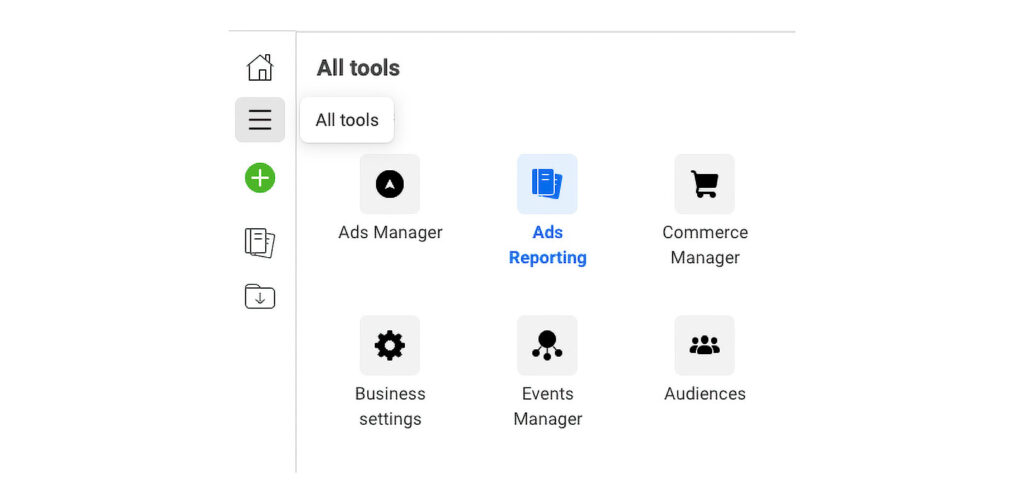
Login to your Page’s Meta Business Suite, and select Ads Reporting under the “All Tools” menu. From there, you’ll be able to create a report and look at the key metrics that we’ll discuss below.

Purchase Conversion Value
Once you understand how Meta talks about “revenue,” adding that data to your reports is a breeze. Whereas Google Analytics simply refers to it as “revenue,” Meta calls it Purchase Conversion Value and defines it as the “total value of purchases.”
There are two important things to keep in mind when you set up your Purchase Conversion Value:
- This metric only works if you have the Meta pixel installed on your website. Installing the pixel involves adding a small snippet of code to your site, which lets Meta know the ad resulted in revenue. For more information on installing your Meta pixel, refer to the Meta Business Help Center.
- Meta self-disclaims that they sometimes estimate this metric, so it’s a good idea to cross-reference Meta’s values with data from Google Analytics or your e-commerce platform to confirm accuracy.
To locate and add Purchase Conversion Value to a report, create a new Report in the Ads Reporting Dashboard in Meta Business Suite manager and click on “Customize”.

Ideally, your Purchase Conversion Value will be greater than your ad budget spend – which would indicate that you’re making money on your Meta ad campaigns (more on that later).
Cost Per Purchase
Cost Per Purchase is an essential metric for reporting how much, on average, visitors are spending when they buy your products from a Facebook or Instagram ad.
Meta defines Cost Per Purchase simply as the “average cost of each purchase.” This metric helps measure the volume of purchases you’re generating from your campaigns.
Again, Meta will automatically generate this number ONLY if you have the Meta pixel installed on your site (see above).
Your benchmarks for Cost Per Purchase will depend on your ad budget spend and the price of the products you’re promoting. For example – if you’re running an ad campaign for products that average $50 and your Cost Per Purchase is below $50 – it could indicate that users are navigating through your site to other cheaper products and buying those instead. It’s important to keep that in mind when looking at this data point.
Return on Ad Spend (ROAS)
This metric brings it all together – a simple, clean view of your campaign’s performance. A successful advertising campaign should have a Return on Ad Spend (ROAS) value greater than 1.
Meta defines ROAS as the “total return on ad spend from purchases.” ROAS is based on approximate* sales that occurred on Meta technologies (Shops, Marketplace, Pages or Messenger) as well as from any connected Meta Business Tools related to your ads.
ROAS can also be manually calculated by dividing revenue by cost. This metric is the crown jewel of the bunch – it’s the most accurate way to measure your campaign’s ROI.

Conclusion
While the Purchase Conversion Value, Cost Per Purchase and ROAS metrics will help you understand your ROI on your Meta Ad campaigns, it’s important to note that they don’t account for the cost of doing business, software expenses, salaries, etc. The cleanest way to figure out Absolute ROI is:
Revenue ÷ (Ad Spend + Expenses) = Return on Investment
If the Absolute ROI from your Meta advertising isn’t what you’d hoped, it might not be time to throw in the towel just yet. Remember to account for the intangible value that comes from increased brand awareness.
You may see evidence that your Meta ads are bringing your brand to the attention of new customers through high impressions on Facebook and Instagram, surges in comments or newsletter signups or, better yet, an overall increase in sales. If so, it may be a wise investment to continue, or even increase, your Meta campaigns.
That said, setting up your Meta reporting to track Purchase Conversion Value, Cost Per Purchase and ROAS is a good way to evaluate the health of your Facebook and Instagram ad campaigns so you can continue to improve them over time. If you’d like help setting up, tracking or optimizing your social media campaigns, don’t hesitate to reach out to us.

